Something About Flow Charts
Flow Charts
An algorithm can be described in many ways. We have already studied how to represent an algorithm in an English-like language (pseudo code). An improvement over this is to mix it with a graphical form of notation such as flowcharts. A flowchart depicts pictorial sequence in which the instructions are carried out in an algorithm. In general a flowchart is a picture, which shows the sequence in which data are read, computing is performed, decision is made and results (outputs) are obtained.
The first formal flowchart is attributed to John Von Neumann in 1945. A flowchart is simply a method of assisting the programmer to layout in visual, two-dimensional format.
In flowcharts each processing step is placed in a “box” and uses arrows to indicate the next step. Different shaped boxes stand for different kinds of operations. The American National Standards Institute (ANSI) groups these boxes into three categories: basic symbols, specialized symbols and additional symbols. Figure-1.7 shows all such possible boxes.
While forming a flowchart one must keep some basic rules in one’s mind, as follows:
1. Use the appropriate boxes as they are designed to use
2. Make the entries within each box very clear
3. Be consistent in the use of boxes
4. Use the annotation symbol when beginning a procedure
Flowchart is used not only as an aid in developing algorithms but also to document algorithms.
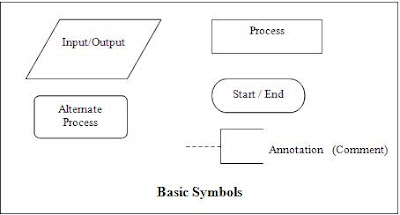
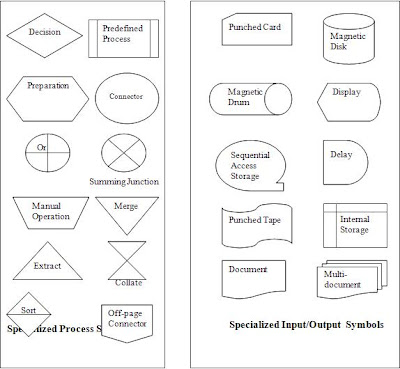
Figure (a)
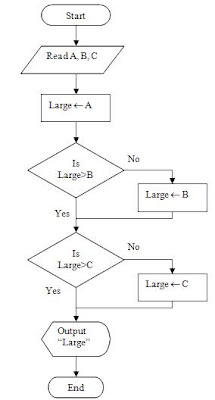
Now let us see how to use a flowchart. For example, let we want to find out the largest number among three numbers, A, B and C. An algorithm for this problem can be constructed as:
1. Read three elements A, B and C
2. Set large = A
3. Compare large with B. If large < B then set large = B
4. Compare large with C. If large < C then set large = C
5. Print the value of large
6. Exit
The flowchart of this algorithm is illustrated in figure-(B)
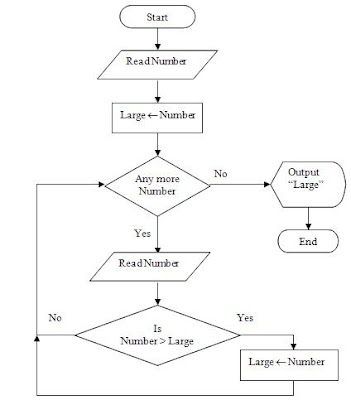
Similarly we can pick the largest number from a set of numbers. Here is the algorithm for this problem:
1. Read any number – Number
2. Set Large = Number
3. Repeat steps 4 and 5 as long as numbers are there in the input
4. Read Number
5. Compare Number and Large. If Number > Large then Large = Number
6. Write the value of “Large”
7. Exit
This procedure is expressed pictorially by the flowchart of figure-(c)
Now let us see another flowchart which shows how to solve a quadratic equation. Here is the algorithm for which finds the roots of a quadratic equation.
- Read A, B, C
- Check If A¬ 0 then go to step 3; otherwise go to step-6
- X¬(-C/B)
- Write the value of X along with the message – “Linear Equation One Root”
- Go to step-14
- Find D¬(B2 – 4AC)
- If D ³ 0 then go to step-7 Else go to step-11
- Find X1 and X2 as
X1 ¬ (-B+ÖD ) / (2A)
X2 ¬ (-B-ÖD ) / (2A)
9. Write the value of X1 and X2 along with the message – “Roots are Real”
10. Go to step-14
11. Set D ¬ (-D)
12. Find X1 and X2 as
X1 ¬ (-B ) / (2A)
X2 ¬ (ÖD ) / (2A)
13. Write the value of X1 along with the message – “Real Part” and X2 along with the message – “Imaginary Part”
14. Exit

Like it on Facebook, Tweet it or share this article on other bookmarking websites.