Get Knowledge About Computer Graphics
In This Article You will Read About these Three :
Interactive Graphics
Passive Graphics
Advantages Of Interactive Graphics
Interactive Graphics
The high-level conceptual framework shown in Figure (a) can be used to describe almost any interactive graphics system. At the hardware level (not shown explicitly in the diagram), a computer receives input from interaction devices, and outputs images to a display device. The software has three components. The first is the application program, it creates, stores into, and retrieves from the second component, the application model, which represents the data or objects to be pictured on the screen. The application program also handles user input. It produces views by sending to the third component, the graphics system, a series of graphics output commands that contain both a detailed geometric description of what is to be viewed and the attributes describing how the objects should appear. The graphics system is responsible for actually producing the picture from the detailed descriptions and for passing the user's input to the application program for processing.
The graphics system is thus an intermediary between the application program and the display hardware that effects an output transformation from objects in the application model to a view of the model. Symmetrically, it effects an input transformation from user actions to inputs to the application program that will cause the application to make changes in the model and/or picture. The fundamental task of the designer of an interactive graphics application program is to specify what classes of data items or objects are to be generated and represented pictorially, and how the user and the application program are to interact in order to create and modify the model and its visual representation. Most of the programmer's task concerns creating and editing the model and handling user interaction, not actually creating views, since that is handled by the graphics system.
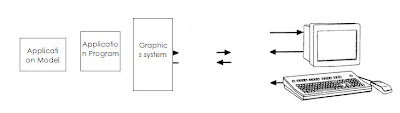
Figure (a): Conceptual framework for interactive graphics
Application Modeling
The application model captures all the data, objects, and relationships among them that are relevant to the display and interaction part of the application program and to any non graphical post processing modules. Examples of such post processing modules are analyses of the transient behavior of a circuit or of the stresses in an aircraft wing, simulation of a population model or a weather system, and pricing computations for a building. In the class of applications typified by "painting" programs such as Mac Paint and PC Paint, the intent of the program is to produce an image by letting the user set or modify individual pixels. Here an explicit application model is not needed—the picture is both means and end, and the displayed bitmap or pixmap serves in effect as the application model.
More typically, however, there is an identifiable application model representing application objects through some combination of data and procedural description that is independent of a particular display device. Procedural descriptions are used, for example, to define fractals. A data model can be as rudimentary as an array of data point.-, or as complex as a linked list representing a network data structure or a relational database storing a set of relations. We often speak of storing the application model in the application database: the terms are used interchangeably here. Models typically store descriptions of primitives (points, lines and polygons in 2D or 3D, and poly hydra and free-form surfaces in 3D) that define the shape of components of the object, object attributes such as line style, color, or surface texture, and connectivity relationships and objects stored that describe how the components fit together.
The objects stored in the model can differ greatly in the amount of intrinsic geometry needed to specify them. At the geometry-is-everything end of the spectrum, an industrial robot of the type discussed in is described almost completely in terms of the geometry of its component poly hydra, each of which is a collection of 3D polygonal facets connected at common edges defined in terms of common vertices and enclosing a volume.
A spreadsheet has much less intrinsic geometry. The spatial relationships between adjacent cells are stored, but the exact size or placement of each cell on the "paper" is not stored, instead, these values are determined dynamically by the spreadsheet program as a function of the contents of cells At the geometry-free end of the spectrum, a demographic model storing statistics, such as income and age of individuals in some population, has no intrinsic geometry. These statistics can then be operated on by a procedure lo derive some geometrical interpretation such as a 2D graph, scatter diagram, or histogram.
Another class of applications without intrinsic geometry deals with the directed-graph networks used in various fields such as engineering and project management. These networks may be represented internally by adjacency matrices describing how nodes are connected, plus some property data for nodes and edges, and the application must then derive a layout in a predefined format in order to create a view of the graph. This representation might be created once and subsequently edited, as for a VLSI circuit layout computed over many hours. The model would then contain both a nongeometric and an almost purely geometric description of the circuit Alternatively, it a layout for a particular application is simple and fast enough to derive, such as a project-scheduling chart with labeled boxes and arrows, it can be created on the fly each time the data on which it based change. Geometric data in the application model often are accompanied by nongeometric textual or numeric property information useful to a post processing program or the interactive user. Examples of such data in CAD applications include manufacturing data; "price and supplier" data; thermal, mechanical, electrical, or electronic properties; and mechanical or electrical tolerances.
Describing to the Graphics System What Is to Be Viewed
The application program creates the application model either a priori as a result of prior computation, as in an engineering or scientific simulation on a supercomputer, or as part of an interactive session at the display device during which the user guides the construction process step by step to choose components and geometric and nongeometric property data. The user can ask the application program at any time to show a view of the model it has created so far. (The word view is used intentionally here. both in the sense of a visual rendering of some geometric properties of the objects being modeled and in the technical database sense of a 2D presentation of some properties of some subset of the model.)
Models are application-specific and are created independently of any particular display system. Therefore, the application program must convert a description of the portion of the model to be viewed from the internal representation of the geometry (whether explicitly stored in the model or derived on the fly) to whatever procedure calls or commands the graphics system uses to create an linage. This conversion process has two phases. First, the application program traverses the application database that stores the model in order to extract the portions to be viewed, using some selection or query criteria. Then, the extracted geometry is put in a formal that can be sent to the graphics system. The selection criteria can be geometric in nature (e.g.. the portion of the model to be viewed has been shifted via the graphics equivalent of a pan or zoom camera operation), or they can be similar to traditional database query criteria
The data extracted during the database traversal must either be geometric in nature or must be converted to geometric data: the data can be described to the graphics system in terms of both primitives that the system can display directly and attributes that control the primitives' appearance. Display primitives typically match those stored in geometric models: lines, rectangles, polygons, circles, ellipses, and text in 2D, and polygons. Poly hydra, and text in 3D. Advanced graphics systems such as PHIGS+ support additional primitives, including curves and surfaces defined by polynomials of higher degrees.
If the model stores geometric primitives not directly supported by the graphics package, the application program must reduce them to those that are accepted by the system. For example, if spheres and free-form surfaces are not supported, the application must approximate such surfaces by tiling or tessellating them with meshes of polygons that the graphics system can handle. Appearance attributes supported by the graphics package also tend to correspond to the ones stored in the model, such as color, line style, and line width. In addition to primitives and primitives and attributes, advanced graphics packages such as PHIGS support facilities for specifying geometric transformations for scaling, rotating, and positioning components, for specifying how components are to be viewed in 3D, and for grouping logically related primitives, attributes, and transformations so that they can be invoked by a single reference to a named structure.
The graphics system typically consists of a set of output subroutines corresponding to the various primitives, attributes, and other elements. These are collected in a graphics- subroutine library or package that can be called from high-level languages such as C, Pascal, or LISP. The application program specifies geometric primitives and attributes to these subroutines, and the subroutines then drive the specific display device and cause it to display the image. Much as conventional I/O systems create logical I/O units to shield the application programmer from the messy details of hardware and device drivers, graphics systems create a logical display device. Thus, the graphics programmer can ignore such details as which part of image generation is done in the display hardware and which is done by the graphics package, or what the coordinate system of the display is. This abstraction of the display device pertains both to the output of images and to interaction via logical input devices. For example, the mouse, data tablet, touch panel, 2D joystick, or trackball can all be treated as the locator logical input device that returns an (x, y) screen location. The application program can ask the graphics system either to sample the input devices or to wait at a specified point until an event is generated when the user activates a device being waited on. With input values obtained from sampling or waiting for an event, the application program can handle user interactions that alter the model or the display or that change its operating mode.
Interaction Handling
The typical application-program schema for interaction handling is the event-driven loop. It is easily visualized as a finite-state machine with a central wait state and transitions to other states that are caused by user-input events. Processing a command may entail nested event loops of the same format that have their own states and input transitions. An application program may also sample input devices such as the locator by asking for their values at any time; the program then uses the returned value as input to a processing procedure that also changes the state of the application program, the image, or the database. The event-driven loop is characterized by the following pseudo code schema:
generate initial display, derived from application model as appropriate
while (!quit) {     /* User has not selected the "quit" option */
enable selection of commands objects
/*  Program pauses indefinitely in "wait state" until user acts  */
wait for user selection
switch (selection) {
process selection to complete command or process completed command.
updating model and screen as needed
}
}
Let's examine the application's reaction to input in more detail. The application program typically responds to user interactions in one of two modes. First, the user action may require only that the screen be updated—for example, by highlighting of a selected object or by making available a new menu of choices. The application then needs only to update its internal state and to call the graphics package to update the screen; it does not need not to update the database. If, however, the user action calls for a change in the model—for example, by adding or deleting a component—the application must update the model and then call the graphics package to update the screen from the model. Either the entire model is retro versed to regenerate the image from scratch, or, with more sophisticated incremental-update algorithms, the screen is updated selectively. It is important to understand that no significant change can take place in the objects on the screen without a corresponding change in the model. The screen is indeed the window on the computer in that the user, in general, is manipulating not an image but the model that is literally and figuratively behind the image. Only in painting and image-enhancement applications are the model and the image identical. Therefore, it is the application's job to interpret user input. The graphics system has no responsibility for building or modifying the model, either initially or in response to user interaction; its only job is to create images from geometric descriptions and to pass along the user's input data.
The event-loop model, although fundamental to current practice in computer graphics, is limited in that the user-computer dialogue is a sequential, ping-pong model of alternating user actions and computer reactions. In the future, we may expect to see more of parallel conversations, in which simultaneous input and output using multiple communications channels—for example, both graphics and voice—take place. Formalisms, not to mention programming-language constructs, for such free-form conversations are not yet well developed, we shall not discuss them further here.
Passive Graphics
A computer graphics operation that transfers automatically and without operator intervention.
Advantages of Interactive Graphics
Graphics provides one of the most natural means of communicating with a computer, since our highly developed 2D and 3D pattern-recognition abilities allow us to perceive and process pictorial data rapidly and efficiently. In Many design, implementation, and construction processes today, the information pictures can give is virtually indispensable. Scientific visualization became an important field in the late 1980s, when scientists and engineers realized that they could not interpret the data and prodigious quantities of data produced in supercomputer runs without summarizing the data and highlighting trends and phenomena in various kinds of graphical representations.
Creating and reproducing pictures, however, presented technical problems that stood in the way of their widespread use. Thus, the ancient Chinese proverb “a picture is worth ten thousand words” became a cliché in our society only after the advent of inexpensive and simple technology for producing pictures—first the printing press, then photography.
Interactive computer graphics is the most important means of producing pictures since the invention of photography and television; it has the added advantage that, with the computer, we can make pictures not only of concrete, “real-world” objects but also of abstract, synthetic objects, such as mathematical surfaces in 4D and of data that have no inherent geometry, such as survey results. Furthermore, we are not confined to static images. Although static pictures are a good means of communicating information, dynamically varying pictures are frequently even better–to time-varying phenomena, both real (e.g., growth trends, such as nuclear energy use in the United States or population movement form cities to suburbs and back to the cities). Thus, a movie can show changes over time more graphically than can a sequence of slides. Thus, a sequence of frames displayed on a screen at more than 15 frames per second can convey smooth motion or changing form better than can a jerky sequence, with several seconds between individual frames. The use of dynamics is especially effective when the user can control the animation by adjusting the speed, the portion of the total scene in view, the amount of detail shown, the geometric relationship of the objects in the another, and so on. Much of interactive graphics technology therefore contains hardware and software for user-controlled motion dynamics and update dynamics.
With motion dynamics, objects can be moved and tumbled with respect to a stationary observer. The objects can also remain stationary and the viewer can move around them , pan to select the portion in view, and zoom in or out for more or less detail, as though looking through the viewfinder of a rapidly moving video camera. In many cases, both the objects and the camera are moving. A typical example is the flight simulator, which combines a mechanical platform supporting a mock cockpit with display screens for windows. Computers control platform motion, gauges, and the simulated world of both stationary and moving objects through which the pilot navigates. These multimillion-dollar systems train pilots by letting the pilots maneuver a simulated craft over a simulated 3D landscape and around simulated vehicles. Much simpler fight simulators are among the most popular games on personal computers and workstations. Amusement parks also offer “motion-simulator” rides through simulated terrestrial and extraterrestrial landscapes. Video arcades offer graphics-based dexterity games and racecar-driving simulators, video games exploiting interactive motion dynamics: The player can change speed and direction with the “gas pedal” and “steering wheel,” as trees, buildings, and other cars go whizzing by. Similarly, motion dynamics lets the user fly around the through buildings, molecules, and 3D or 4D mathematical space. In another type of motion dynamics, the “camera” is held fixed, and the objects in the scene are moved relative to it. For example, a complex mechanical linkage, such as the linkage on a stream engine, can be animated by moving or rotating all the pieces appropriately.
Update dynamics is the actual change of the shape, color, or other properties of the objects being viewed. For instance, a system can display the deformations of an airplane structure in flight or the state changes in a block diagram of a nuclear reactor in response to the operator’s manipulation of graphical representations of the many control mechanisms. The smoother the change, the more realistic and meaningful the result. Dynamic interactive graphics offers a large number of user-controllable modes with which to encode and communicate information: the 2D or 3D shape of objects in a picture, their gray scale or color, and the time variations of these properties. With the recent development of digital signal processing (DSP) and audio synthesis chips, audio feedback can now be provided to augment the graphical feedback and to make the simulated environment even more realistic.
Interactive computer graphics thus permits extensive, high-bandwidth user-computer interaction. This significantly enhances our ability to understand data, to perceive trends, and to visualize real or imaginary objects–indeed, to create “virtual worlds” that we can explore from arbitrary points of view. By making communication more efficient, graphics make possible higher-quality and more precise results or products, greater productivity, and lower analysis and design costs.
Representative Uses of Computer Graphics
Computer graphics is used today in many different areas of industry, business, government, education, entertainment, and most recently, the home. The list of applications is enormous and is growing rapidly as computers with graphics capabilities become commodity products. Let`s look at a representative sample of these areas.
- User interfaces: As soon mentioned, most applications that run on personal computers and workstations, and even those that run on terminals attached to time shared computers and network compute servers, have user interfaces that rely on desktop window systems to manage multiple simultaneous activities, and on point and click facilities to allow users to select menu items, icons, and objects on the screen; typing is necessary only to input text to be stored and manipulated. Word-processing , spreadsheet, and desktop-publishing programs are typical applications that take.
- Advantage of such user-interface techniques: The authors of this book used such programs to create both the text and the figures; then , the publisher and their contractors produced the book using similar typesetting and drawing software.
- (Interactive) plotting in business, science and technology: The next most common use of graphics today is probably to create 2D and 3D graphs of mathematical, physical, and economic functions; histograms, bar and pie charts; task-scheduling charts; inventory and production charts, and the like . All these are used to present meaningfully and concisely the trends and patterns gleaned from data, so as to clarify complex phenomena and to facilitate informed decision making.
- Office automation and electronic publishing: The use of graphics for the creation and dissemination of information has increased enormously since the advent of desktop publishing on personal computers. Many organizations whose publications used to be printed by outside specialists can now produce printed materials inhouse. Office automation and electronic publishing can produce both traditional printed (hardcopy) documents and electronic (softcopy) documents that allow browsing of networks of interlinked multimedia documents are proliferating
- Computer-aided drafting and design: In computer-aided design (CAD), interactive graphics is used to design components and systems of mechanical , electrical, electromechanical, and electronic devices, including structure such as buildings, automobile bodies, airplane and ship hulls, very large scale-integrated (VLSI) chips, optical systems, and telephone and computer networks. Sometimes, the use; merely wants to produce the precise drawings of components and assemblies, as for online drafting or architectural blueprints Color Plate 1.8 shows an example of such a 3D design program, intended for nonprofessionals also a customize your own patio deck” program used in lumber yards. More frequently however the emphasis is on interacting with a computer based model of the component or system being designed in order to test, for example, its structural, electrical, or thermal properties. Often, the model is interpreted by a simulator that feeds back the behavior of the system to the user for further interactive design and test cycles. After objects have been designed, utility programs can postprocess the design database to make parts lists, to process ‘bills of materials’, to define numerical control tapes for cutting or drilling parts, and so on.
- Simulation and animation for scientific visualization and entertainment: Computer produced animated movies and displays or the time-varying behavior of real and simulated objects are becoming increasingly popular for scientific and engineering visualization. We can use them to study abstract mathematical entries as well as mathematical models of such phenomena as fluid flow, relativity, nuclear and chemical reactions, physiological system and organ function, and deformation of mechanical structures under various kinds of loads. Another advanced-technology area is interactive cartooning. The simpler kinds of systems for producing ‘Flat” cartons are becoming cost-effective in creating routine ‘in-between” frames that interpolate between two explicity specified ‘key frames”. Cartoon characters will increasingly be modeled in the computer as 3D shape descriptions whose movements are controlled by computer commands, rather than by the figures being drawn manually by cartoonists . Television commercials featuring flying logos and more exotic visual trickery have become common, as have elegant special effects in movies. Sophisticated mechanisms are available to model the objects and to represent light and shadows.
- Art and commerce: Overlapping the previous categories the use of computer graphics in art and advertising here, computer graphics is used to produce pictures that express a message and attract attention. Personal computers and Tele text and Videotexts terminals in public places such as in private homes, offer much simpler but still informative pictures that let users orient themselves, make choices, or even “tale shop” and conduct other business transactions. Finally, slide production for commercial, scientific, or educational presentations is another cost-effective use of graphics, given the steeply rising labor costs of the traditional means of creating such material.
- Process control: Whereas flight simulators or arcade games let users interact with a simulation of a real or artificial world, many other applications enable people or interact with some aspect of the real world itself. Status displays in refineries, power plants, and computer networks show data values from sensors attached to critical system components, so that operators can respond to problematic conditions. For example, military commanders view field data – number and position of vehicles, weapons launched, troop movements, causalities – on command and control displays to revise their tactics as needed; flight controller airports see computer-generated identification and status information for the aircraft blips on their radar scopes, and can thus control traffic more quickly and accurately than they could with the uninitiated radar data alone; spacecraft controllers monitor telemetry data and take corrective action as needed.
- Cartography: Computer graphics is used to produce both accurate and schematic representations of geographical and other natural phenomena from measurement data. Examples include geographic maps, relief maps, exploration maps for drilling and mining , oceanographic charts, weather maps, contour maps, and population-density maps.
Note : I hope you will get atleast a little bit knowledge form it.

Like it on Facebook, Tweet it or share this article on other bookmarking websites.